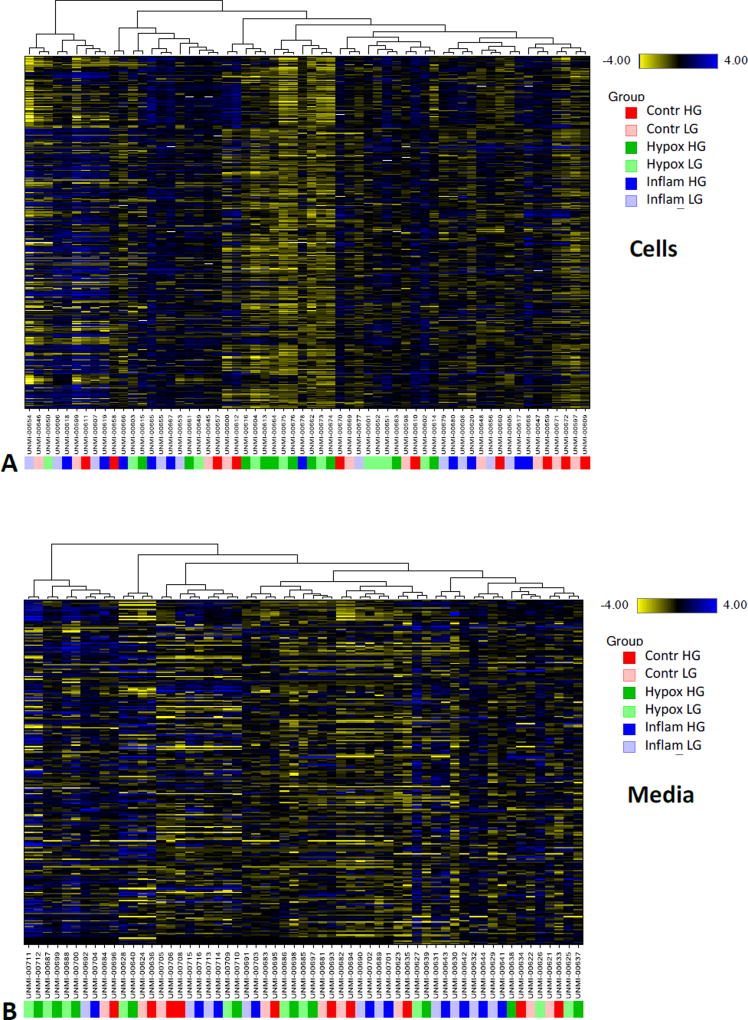
Figure 1.
Hierarchical clustering of the present metabolomics data in cell (A) and media samples (B) obtained from human islets (n = 10) cultured under different conditions as indicated (control, hypoxia, and inflammatory cytokines with low or high glucose). Within the clusters, blueish coloring represent elevated metabolite levels, while yellowish coloring represent decreased metabolite levels. Samples are color-coded as indicated by the figure key on the right side.

