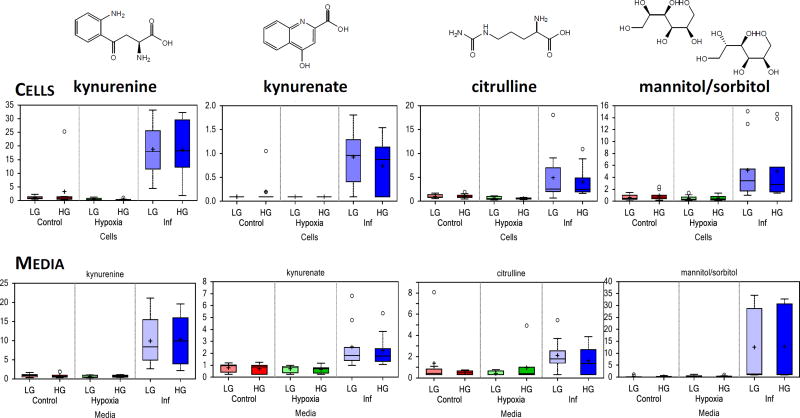
Figure 3.
Box plot data illustrating some of the metabolite significantly altered in both cell and media samples by culture in the presence of inflammatory cytokines (cocktail of IL-1β, IFN-γ, and TNF-α for 24 + 24 h). Notation is the same as in Figure 2. For inflammation-induced changes, compare blue vs. red columns (lighter and darker shades for changes under LG and HG conditions, respectively).

