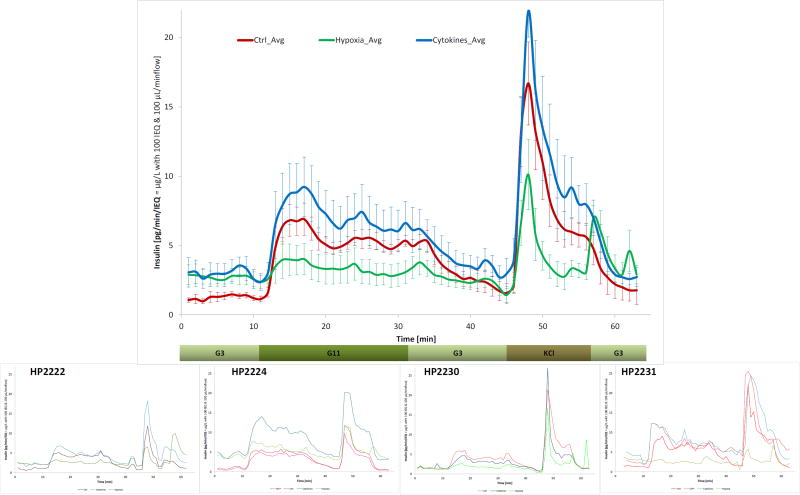
Figure 8.
Dynamic glucose-stimulated insulin release (GSIR) perifusion data for islets following different incubation conditions from the present study. All data here are from islets cultured with basal glucose for the entire 48 h. The main figure shows the average secreted insulin collected every minute for a low (3 mM) → high (11 mM) → low (3 mM) glucose challenge followed by a KCl step. Data are for n = 4 different islet samples; results of the individual perifusions are shown in the small insets.

