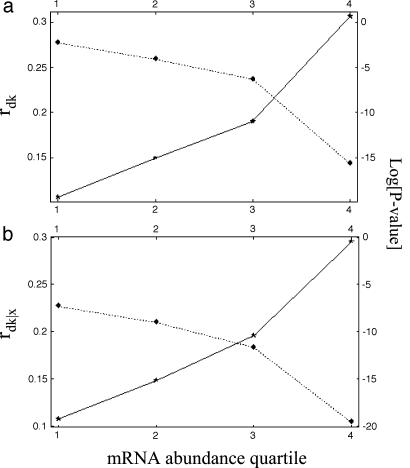
Fig. 1.
The Spearman rank correlation coefficient, rdk (a), and partial correlation coefficient, rdk|x (b), between protein dispensability d (Warringer et al. data set; see Materials and Methods), and evolutionary rate, k, as a function of mRNA abundance quartile. Expression quartile is shown on the x axis. Correlation coefficient values are indicated by stars, and P values are indicated by diamonds. The points are joined only for visual clarity.

