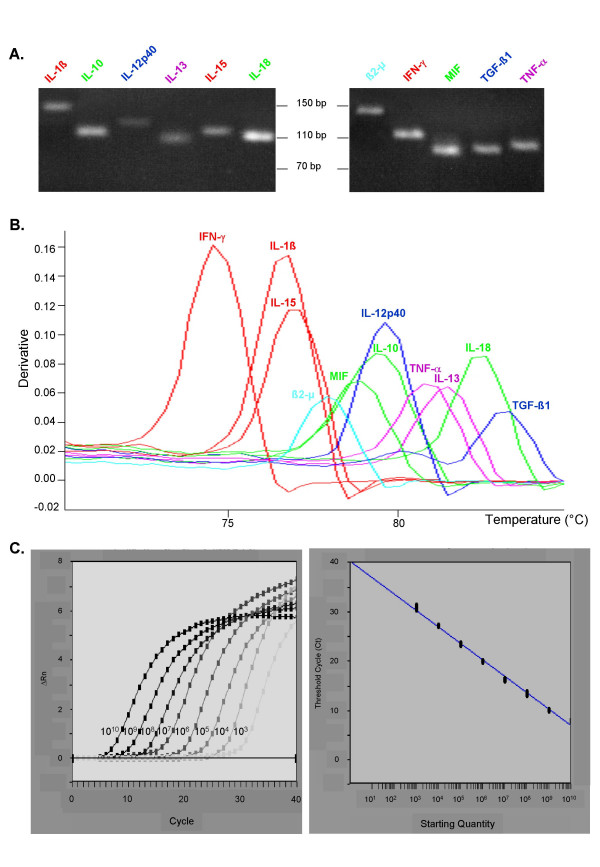
Figure 1.

Primer validation. A. Agarose gel electrophoresis of several CyProQuant-PCR products generated by amplification of a pool of cDNA from PBMC stimulated in vitro by LPS or PHA. Scale is shown in base pairs (bp). B. Dissociation curve analysis of these CyProQuant-PCR products. Negative derivative of the fluorescence is plotted against temperature. The single peak shows that SYBR Green fluorescence detects only the specific CyProQuant-PCR product. C. Amplification plots and standard curve resulting from the amplification of a range of β2-MG external RNA standard using CyProQuant-PCR.
