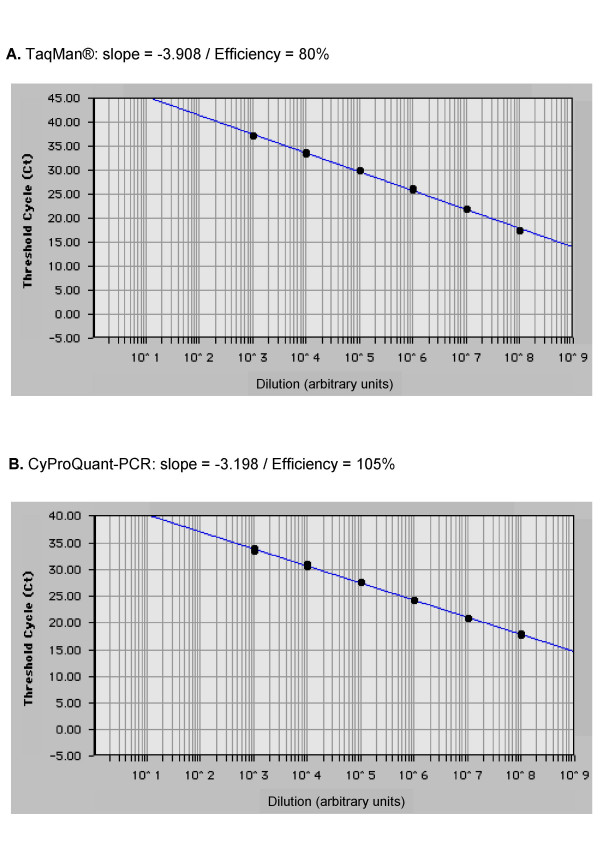
Figure 2.

Comparison to TaqMan® technology. Total RNA was extracted from isolated monocytes stimulated for 6 hours by LPS, serial-diluted 1:10 and retro-transcribed to generate standard curves by plotting the CT against the concentration of this cellular RNA in arbitrary units. TNF-α transcripts were amplified by real time PCR using either (A) the TaqMan® commercial kit and the TaqMan® universal PCR master mix or (B) our primers and the SYBR Green PCR master mix. Data represent the standard curves obtained for the two techniques, their slopes and the deducted efficiencies.
