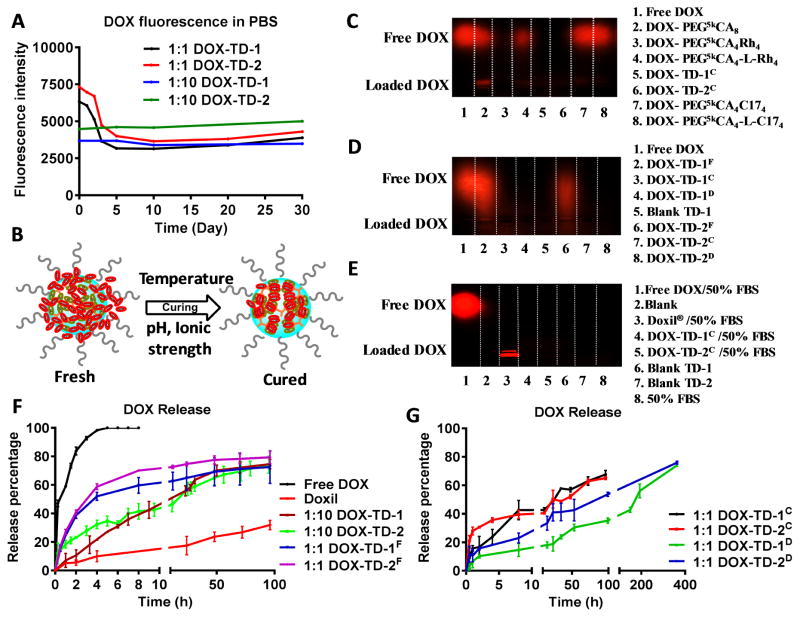
Fig. 3. DOX loading stability and in vitro DOX release profiles.
(A) Fluorescence quenching of DOX-TD-1 and DOX-TD-2 at a DOX concentration of 1 mg/mL in PBS monitored for 1-month. (B) Cartoon illustrates the dynamic molecular stacking during the curing processes by time or the increased temperature and ionic strength. (C–E) Agarose gel electrophoresis of (C) free DOX, DOX-TD-1, DOX-TD-2, and other previously reported TD-based DOX nanoformulations,[43, 58] (D) fresh, cured, and dialyzed DOX-TD-1 and DOX-TD-2, and (E) free DOX, Doxil®, cured DOX-TD-1 and DOX-TD-2 incubated with 50% FBS. (F) In vitro cumulative DOX release profiles of free DOX, Doxil®, fresh 1:1 and 1:10 DOX-TD-1 and DOX-TD-2 nanoformulations in PBS at 37 °C. ( G) In vitro cumulative DOX release profiles of cured and dialyzed DOX-TD-1 and DOX-TD-2 nanoformulations in PBS at 37 °C. The fluorescence of DOX remained in t he dialysis bag at different time points were measured. Data are represented as a mean ± SD of triplicate samples.

