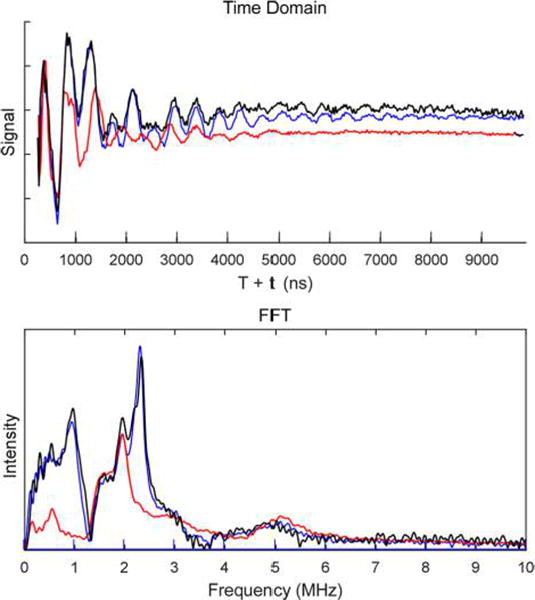
Figure 3.

X-band (9.4 GHz) 3P-ESEEM time domain (top) and Fourier transform of the time domain (bottom) of MiNifB. Black trace, WT MiNifB reduced with 10 mM DTH in the presence of 3 mM 14N-SAM. Blue trace, WT MiNifB reduced with 10 mM DTH in the presence of 3 mM 15N-SAM. Red trace, DM variant reduced with 10 mM DTH in the absence of SAM.
