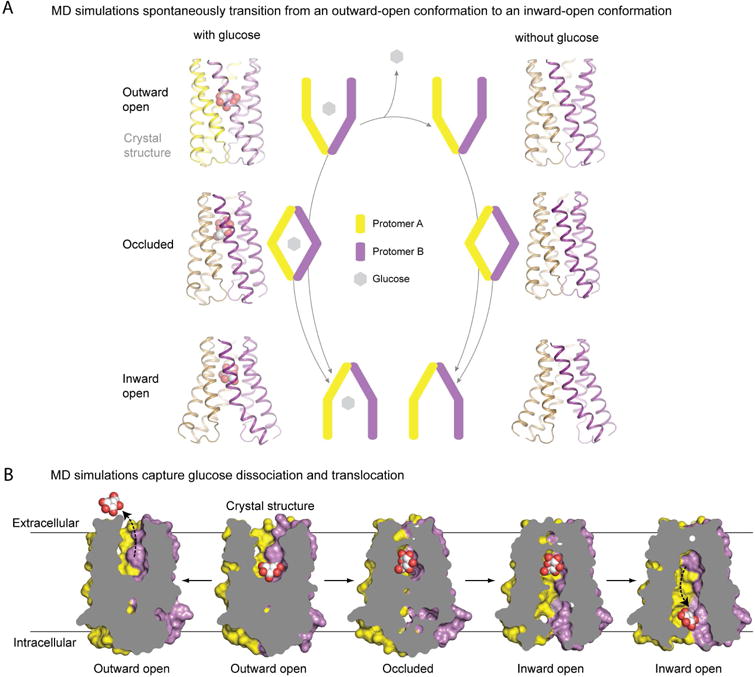
Figure 2. Conformational states and substrate translocation in LbSemiSWEET revealed by unguided simulations.

(A) Schematic of major conformational states in the SemiSWEET transport cycle (center). Arrows indicate the conformational transitions observed during MD simulations. The two protomers are colored yellow and purple, respectively. Corresponding simulation snapshots are shown to the left and right. (B) Slab representations of the major conformational states observed in simulations initiated from the outward-open, glucose-bound crystal structure. The transition to the left depicts glucose dissociation into the bulk from Simulation 3. The transition to the right shows the position of glucose in occluded and inward-open states before escaping the binding pocket in Simulation 9. See also Table S2.
