
Figure 3. Crystallographic validation of simulations.
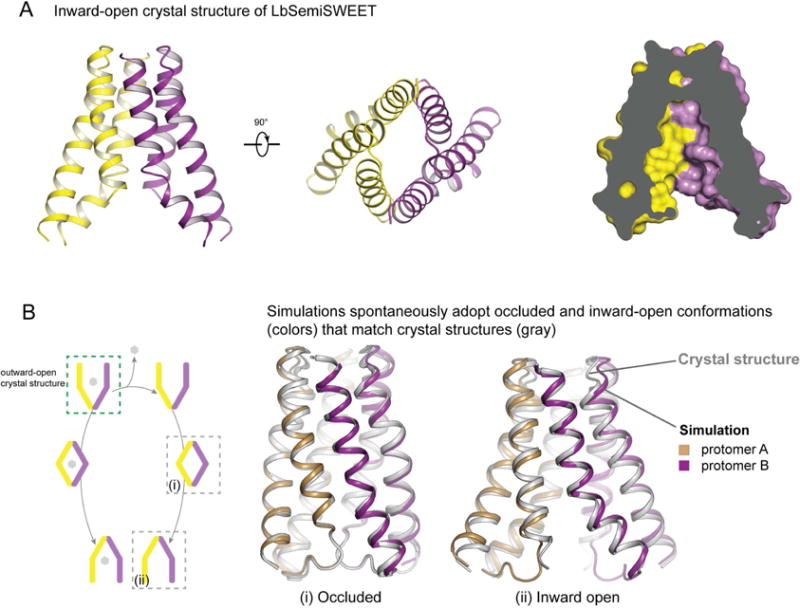
(A) Ribbon representation of LbSemiSWEETQ20A in an inward-open conformation (left) and slab views of LbSemiSWEET in an inward-open conformation. One protomer is shown in yellow and the other is in purple. (B) Comparison of simulated and crystallographic conformational states. Simulations started from the outward-open crystal structure, with and without glucose bound, transition spontaneously to occluded and inward-open conformational states (dark colors) that closely match crystal structures (silver). Boxes in B (left) indicate conformational states captured crystallographically, and simulation overlays (right) compare conformational states visited in simulations to crystal structures. See also Figure S2, S3 and Table S1.