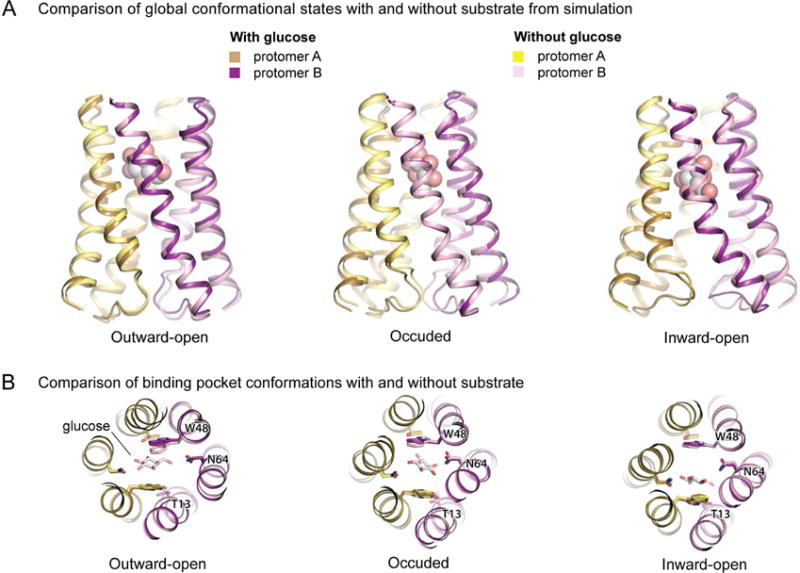
Figure 6. Comparison of simulations in the presence and absence of substrate.

Snapshots are taken from simulation frames closest in protein backbone Cα RMSD to the ensemble average structure for each conformational state (see Methods). (A) Overlays of snapshots taken from simulations with and without glucose reveal that essentially the same conformational states are adopted under each condition. (B) Overlays of simulation snapshots of the substrate-binding pocket in each major conformational state reveal similar binding pocket conformations in the presence and absence of glucose. See also Figure S6 and Table S2.
