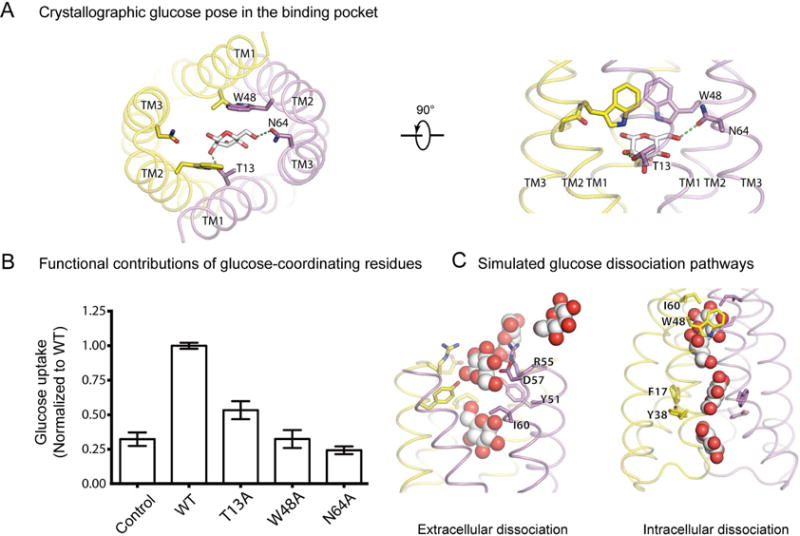
Figure 7. Substrate recognition and translocation.

(A) Glucose coordination by substrate recognition residues in the outward-open crystal structure. Glucose is shown in silver sticks. Hydrogen bonds are indicated by green dotted lines. (B) Glucose (14C) uptake activities for LbSemiSWEET with alanine point mutations of substrate-binding residues compared to wild-type SemiSWEET and control (empty vector) (±s.d., n=3). (C) Extracellular (left) and intracellular (right) glucose dissociation paths shown using overlaid, down-sampled frames taken from Simulation 3 and Simulation 9, respectively. See also Figure S7 and Table S2.
