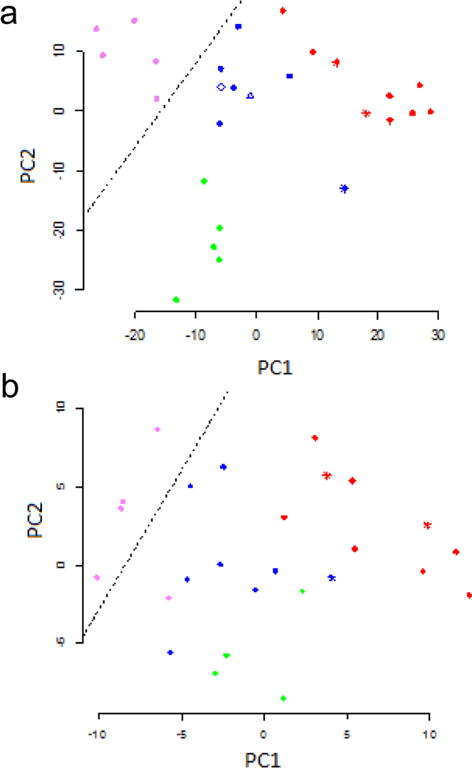
Figure 2.

Principal components analysis of the cell lines. (a) Analysis using all 399 glycoproteins. The decision boundary separates the claudin-low cell lines from the others. (b) Principal components analysis using a random set of 50 glycoproteins. Color key: nonmalignant, green; basal, blue (HCC38 is the triangle, HCC1395 the diamond); claudin-low, violet; luminal, red. The asterisks correspond to cell lines that over-express HER2.
