Figure 3.

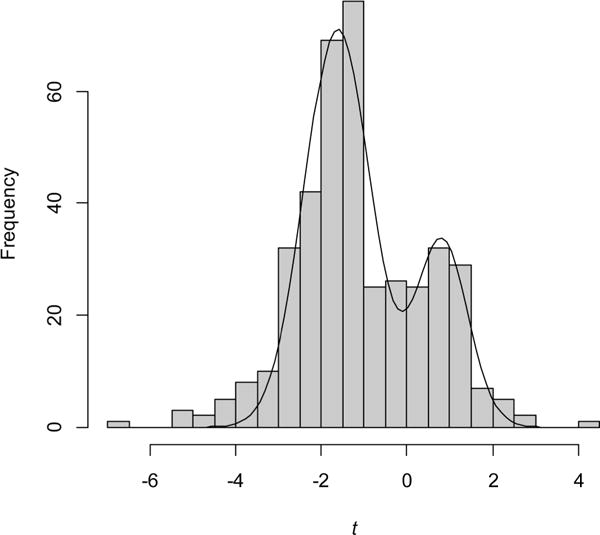
Frequency distribution for two-sample t statistics. The curve is the sum of two normal distributions with means of −1.63 and 0.82 and standard deviations of 0.77 and 0.61.

Frequency distribution for two-sample t statistics. The curve is the sum of two normal distributions with means of −1.63 and 0.82 and standard deviations of 0.77 and 0.61.