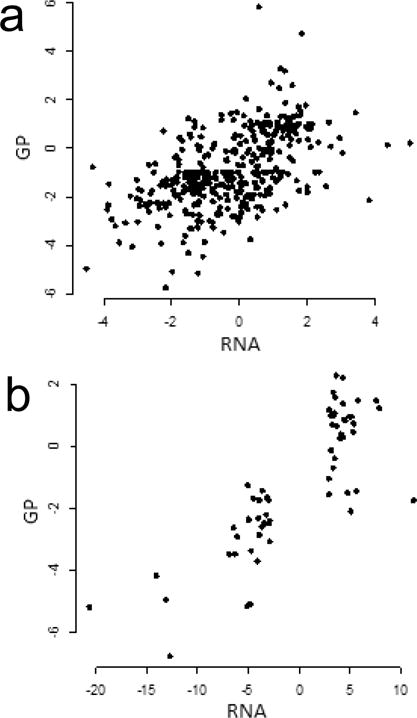
Figure 4.

Relation between changes in expression of mRNA and glycoproteins. (a) Scatterplot of t statistics for mRNA and the claudin-low glycoproteins identified in this study. There are 391 proteins for which both mRNA and glycoprotein data are available. (b) Scatterplot of scores (logarithms of fold change) for differentially expressed mRNA from the nine cell line claudin-low predictor data set (Supplemental Data from Prat et al.9) and t statistics for glycoproteins. There are 61 genes for which both mRNA and glycoprotein data are available.
