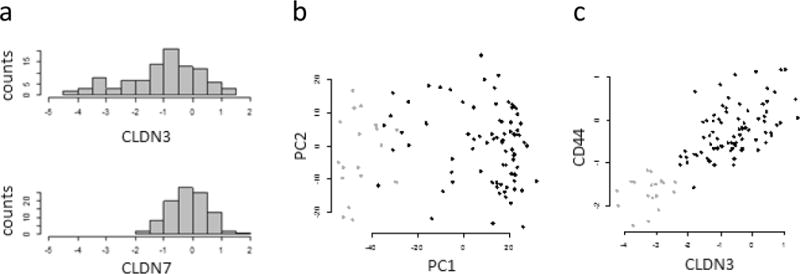
Figure 5.

Claudins and CD44 in a breast tumor data set (CPTAC). (a) Frequency distribution of CLDN3 and CLDN7 expression. The tail of 18 samples on the left of the CLDN3 data was used to identify the claudin-low samples. (b) Principal components plot. The claudin-low samples are identified by the violet symbols. (c) Association between CLDN3 and CD44.
