
Fig. 3.
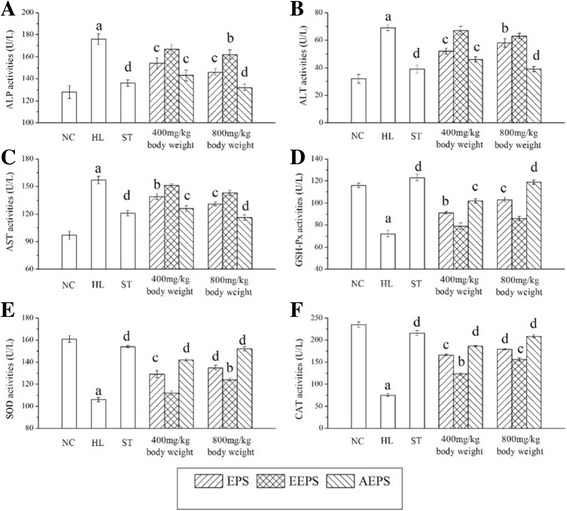
Effects of EPS, EEPS and AEPS on activities of (a) ALP, (b) ALT, (C) AST, (d) GSH-Px, (e) SOD and (f) CAT in serum. The values were reported as the mean ± SD of eight mice per group. a Significant 306 difference compare to NC, P < 0.001. b Significant difference compare to MC, P < 0.01. c Significant difference compare to MC, P < 0.05. d Significant difference compare to MC, P < 0.001