
Fig. 5.
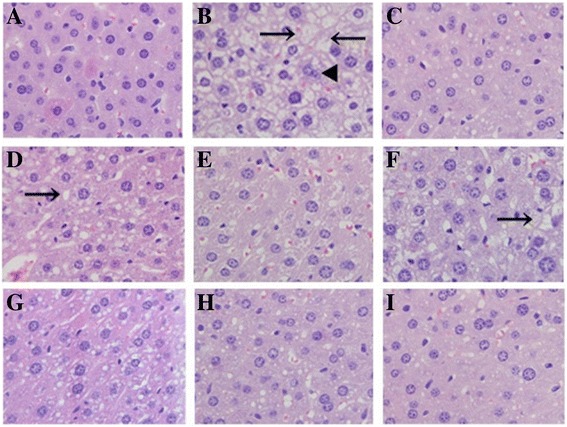
Effects of EPS, EEPS and AEPS on hepatic cells in the hyperglycemia mice (hematoxylin-eosin staining, 400×). (a) NC group, (b) HL group, (c) ST group, (d) L-EPS, (e) H-EPS, (f) L-EEPS, (g) H-EEPS, (h) L-AEPS and (i) H-AEPS (n = 8). Arrows show fat granule in cell, triangles indicate condensation or disappearance of cellular nucleus