
Fig. 2.
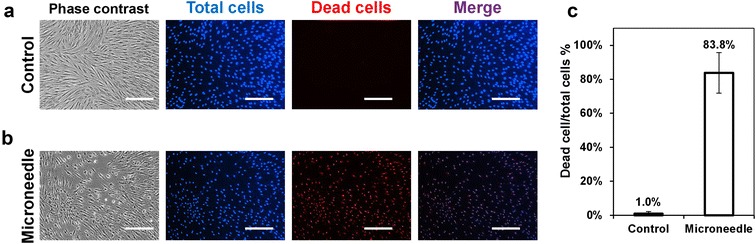
Microneedle application on keloid fibroblast culture. Representative phase contrast, blue and red fluorescence images of a control (untreated cells) and b microneedle-treated keloid cells incubated with Hoechst 33342 and propidium iodide. Images to the right are blue and red merged. c Quantification of dead/total cell proportion (%); N = 4, >1000 cells analyzed. Scale bar represents 100 μm