
Fig. 1.
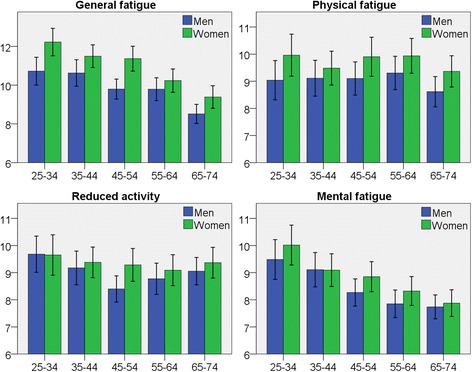
Bar charts for each subscale of fatigue according to age-groups (years). Y-axis with mean fatigue score. Error bars 95% CI
Official websites use .gov
A
.gov website belongs to an official
government organization in the United States.
Secure .gov websites use HTTPS
A lock (
) or https:// means you've safely
connected to the .gov website. Share sensitive
information only on official, secure websites.
Bar charts for each subscale of fatigue according to age-groups (years). Y-axis with mean fatigue score. Error bars 95% CI