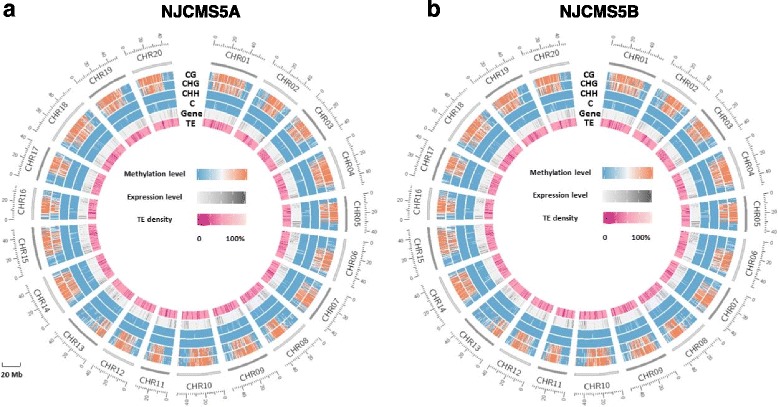
Fig. 3.

Circle plots of gene expression level, transposable element (TE) density and methylation level in the mC, mCG, mCHG and mCHH contexts of soybean (a) NJCMS5A and (b) NJCMS5B. TE indicated “TE density”; Gene indicated “gene expression level”; C, CG, CHH and CHG indicated “methylation level in mC, mCG, mCHG and mCHH, respectively”. Gene expression level was calculated by fragments per kilobase of exon model per million mapped fragments (RPKM). Data is plotted for 20 Mb windows in all soybean chromosomes (CHR01-CHR20). Gene expression level (from light colour to dark colour) indicates the level from 0 to 100%, and TE density (from dark colour to light colour) indicates the density from 0 to 100%
