
Fig. 1.
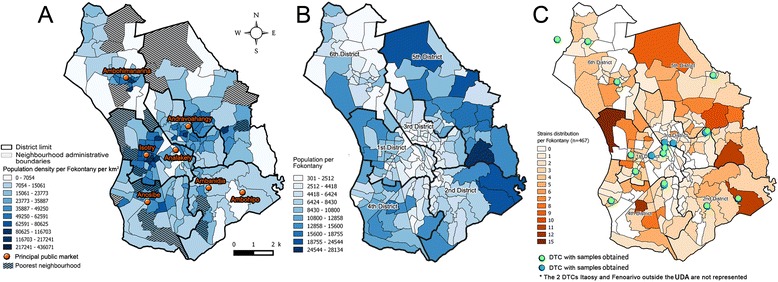
Structure of the urban district of Antananarivo (UDA). a describes the distribution of population density per Fokontany and the localization of the principal public markets in the UDA. The poorest Fokontany are hatched. b describes the distribution of the most populous Fokontany. c describes the distribution of TB cases recruited for the study. TB diagnosis and treatment centers included in the study where represented in green or blue point