
Fig. 3.
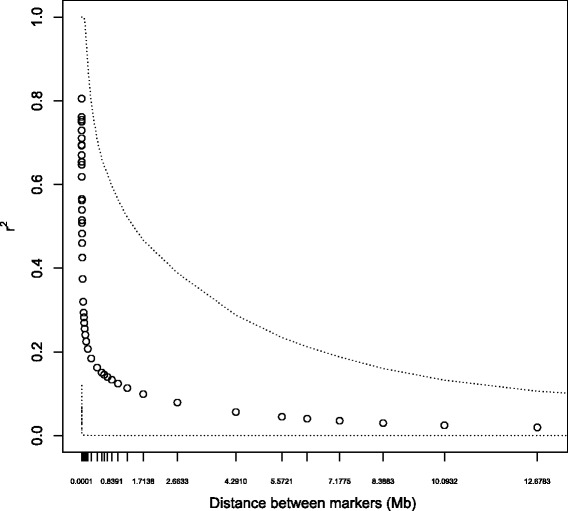
Pattern of linkage disequilibrium as a function of marker distance for UK Labrador Retrievers: points represent average r 2 for pairs of markers in bins of specified average between-marker distance. Dotted lines indicate the 2.5th and 97.5th percentiles of the r 2 distribution (i.e. where 95% of the data points are located)