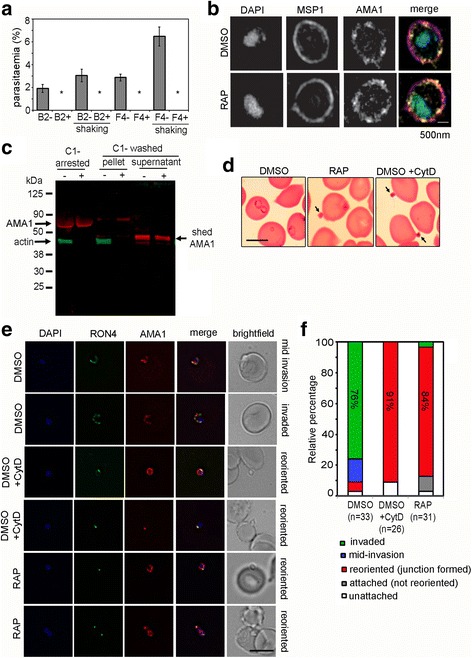
Fig. 5.

PfACT1 KO merozoites can secrete their micronemes and form a tight junction (TJ) but cannot invade erythrocytes. a No reinvasion is observed for the RAP-treated population (+) in invasion assays with schizonts purified from two distinct clones B2 and F4. Even upon vigorous shaking, which improved reinvasion rates of the DMSO controls (–), a complete abrogation of invasion was apparent in the RAP-treated population (*). N > 1000 in each case. Error bars represent SD. b Super-resolution microscopy of free merozoites. Colocalisation of AMA1 and MSP1 on the surface of PfACT1 KO (RAP) and control (DMSO) populations indicates that secretion of AMA1 is not ablated in the absence of PfACT1. Scale bar 500 nm. c A dual Western blot with anti-AMA1 and anti-PfACT1 antibodies reveals that AMA1 is processed and shed in culture supernatants of the PfACT1 KO population (+), indicating the ability of the PfACT1 KOs to secrete, process and shed AMA1. Note that some AMA1 remains unprocessed in the KOs, perhaps indicative of dysregulation of secretion in a small population of the merozoites. As expected, PfACT1 is absent in the RAP-treated (+) population and is absent in the culture supernatants, confirming integrity of the parasite membranes during the experiment. d Merozoites are attached to erythrocytes (arrowed) in Giemsa-stained thin blood films from the PfACT1 KO population (RAP), which phenocopies cytochalasin-D treatment during invasion (DMSO + CytD). DMSO controls reinvade and form ring stages during the time frame of the experiment (DMSO). Scale bar 5 μm. e IFA of TJ formation. Colocalisation of rhoptry neck protein 4 (RON4) and AMA1 at the merozoite-erythrocyte boundary indicates successful TJ formation in DMSO controls (upper two panels), controls treated with cytochalasin D (middle two panels) and in PfACT1 KOs (lower two panels). The state of invasion of the merozoite is depicted on the right of the panels (brightfield). Scale bar 5 μm. f Relative percentages of the state of invasion of merozoites in each of the cases is drawn as a relative bar graph. Each merozoite counted was binned to one of the following groups: invaded, mid-invasion, reoriented, attached (not reoriented) and unattached. The numbers counted have been indicated. Note that the PfACT1 KO (RAP) population closely phenocopies the cytochalasin-D-treated population
