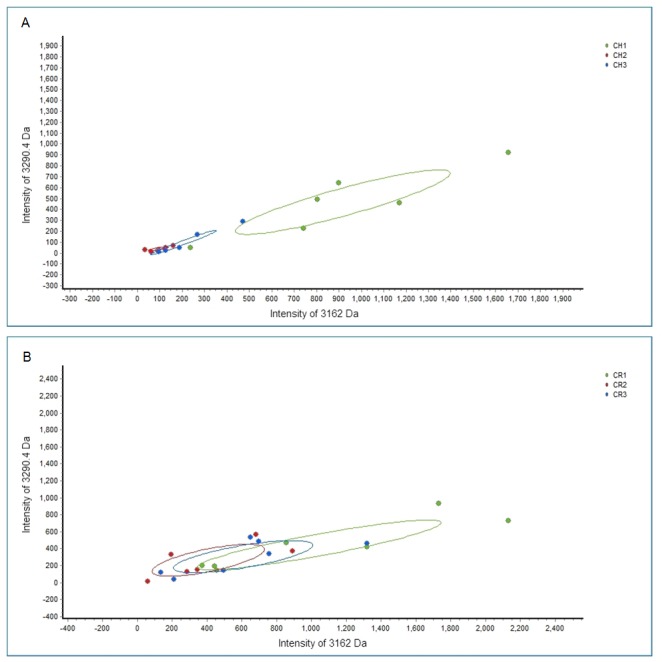
Fig 4. Scatter plots of CH and CR groups.

Scatter plots of all 3 groups before and after treatment of children without relapse (A) and those with relapse (B) established by combining the peptides at 3162.0 and 3290.4 Da, showing well-distinguished curve fitting in the CH group.
