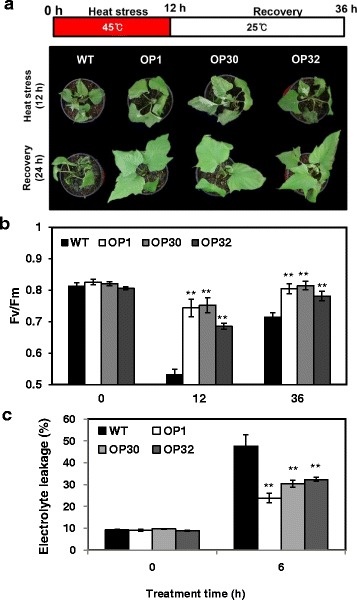
Fig. 2.

Phenotypic and physiological analyses of OP plants under heat stress treatment (45 °C) and after recovery at 25 °C. a Visible damage in the leaves of sweetpotato plants after 12 h heat stress treatment and 24 h recovery. b PSII photosynthetic efficiency (Fv/fm) in the leaves of WT and OP plants after 12 h heat stress treatment and 24 h recovery. c Analysis of electrolyte leakage. Data are expressed as the mean ± SD of three replicates. Asterisks indicate significant differences between WT and OP plants by ANOVA at * p < 0.05 and ** p < 0.01
