
Fig. 1.
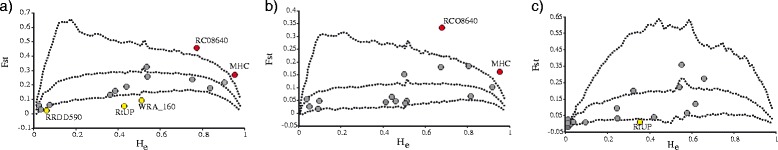
FST vs expected heterozygosity for each 15 microsatellite and the MHC II exon 2 locus. Black dashed lines show the upper and lower 99% confidence intervals with 10,000 simulations from a stepwise mutation model (SMM), loci under neutrality expectations are colored in grey, loci under differential selection are colored in yellow and loci under diversifying selection are colored in red. Figure a represent the plot for the entire gradient, figure b the southern cluster and figure c northern clusters, respectively