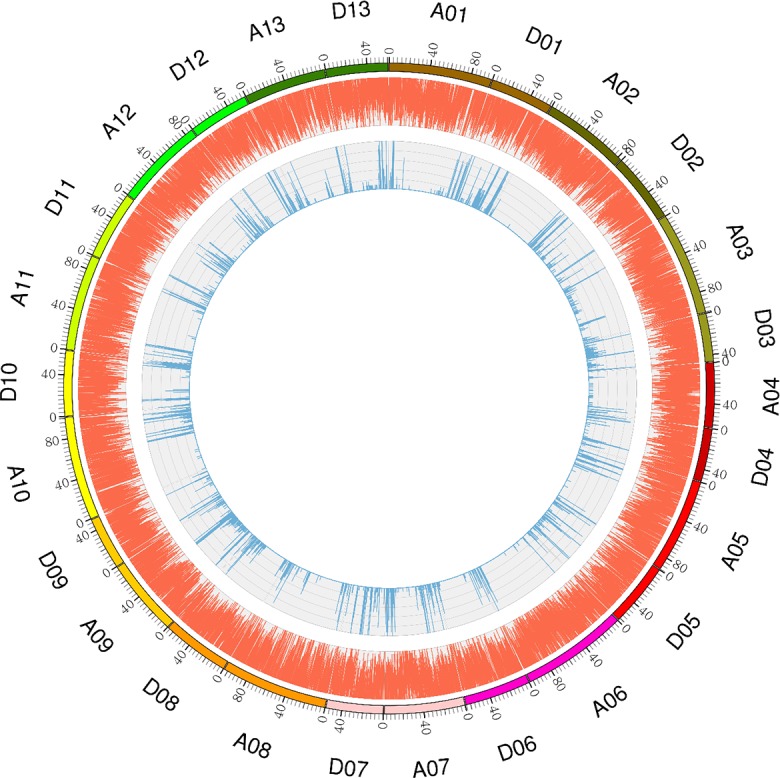
Fig 2. Genome-wide distribution of SNPs throughout the LU28 and ZHONG213 genomes.

The outermost box with scale represents the 26 cotton chromosomes. The orange histogram represents the density of SNPs that are polymorphic between LU28 and ZHONG213; the blue histogram indicates the density of aa×bb markers between LU28 and ZHONG213.
