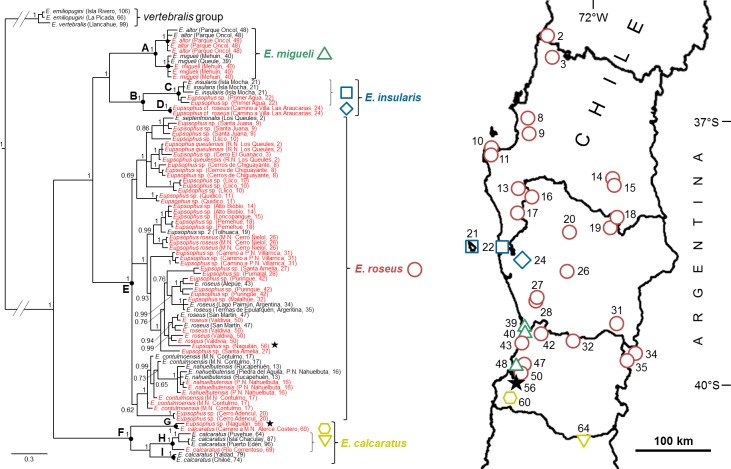
Fig 3. Bayesian consensus tree showing the relationships among the nominal species of Eupsophus and new populations of the roseus group.
The tree was simplified by deleting the outgroup (Alsodes barrioi) and shortening the more basal branches (indicated by parallel lines). Samples in red correspond to the specimens added in this study. Numbers along the nodes indicate posterior probability values. The scale bar below the tree represents the expected substitutions per site. Nodes labeled A, C, D, E, G, H, and I indicate the seven candidate species obtained with mPTP and relaxed ABGD analyses (Fig 4); the map on the right shows with different colored symbols the localities corresponding to six of these seven lineages (clade I distributes further south, out of the map). Nodes A, B, E, and F correspond to the result of the conservative ABGD analysis, which is our favored estimate of species of the roseus group (localities of the four species depicted with the same colors of the Fig 4). The black stars in the tree indicate the samples of E. roseus and E. calcaratus (as identified here) found in syntopy (Naguilán, locality indicated by the star in the map). Dark lines within Chile represent boundaries of Administrative Regions.

