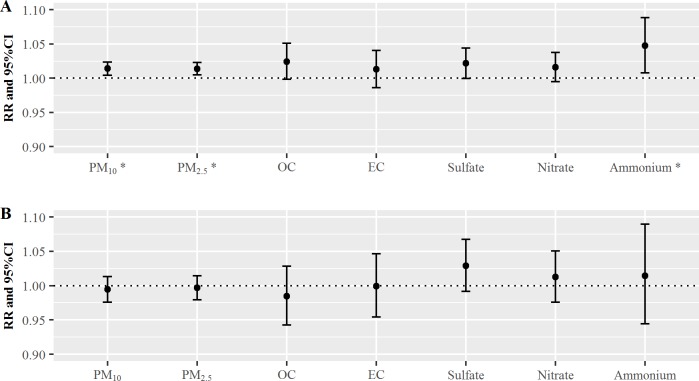
Fig 1.
The relative risks (RRs) of cardiovascular (A) and respiratory (B) diseases on lag 0 day per one-interquartile range increase in PM2.5 and its components. * PM10, PM2.5, and ammonium were associated with increased risks of cardiovascular disease. CI: confidence interval, OC: organic carbon, EC: elemental carbon. Lag 0 day indicates that the RRs were measured on the day of exposure.

