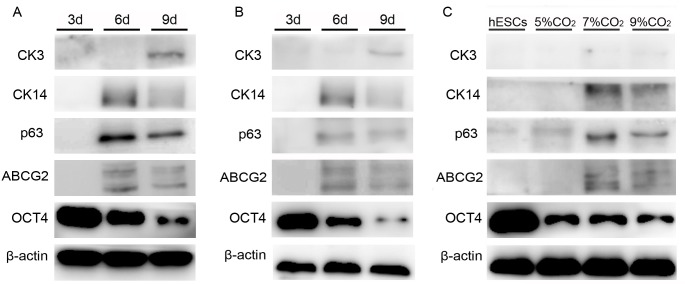
Fig 5. Protein expression of CEPC and hESC markers at different time points and in different culture conditions.
(A-B) ABCG2, p63, CK14, CK3, and OCT4 protein expression in the 7% CO2 (A) and 9% CO2 (B) groups at different time points (3, 6, and 9 days). (C) Protein level of ABCG2, p63, CK14, CK3, and OCT4 at 5%, 7%, and 9% CO2 at day 6 of differentiation. The undifferentiated hESCs were used as the control group.

