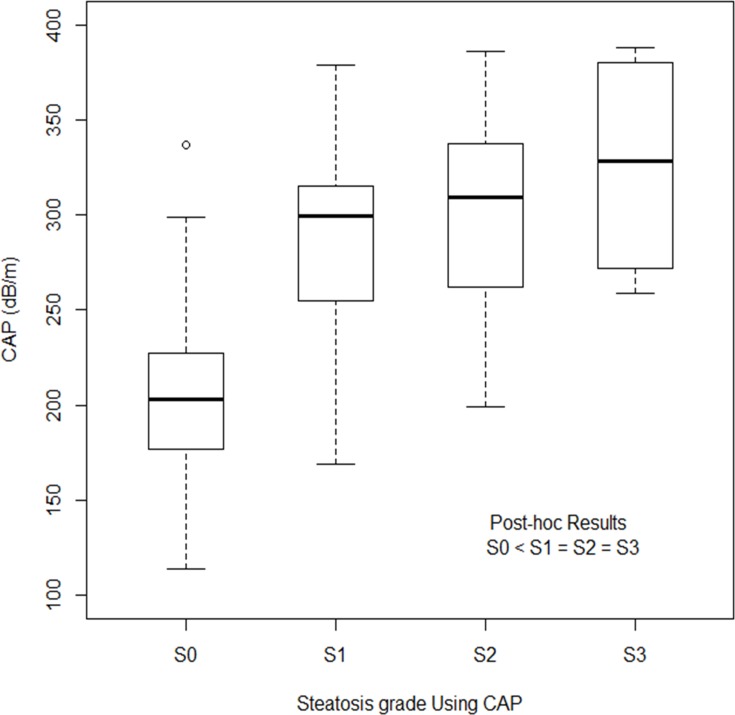
Fig 2. The distribution CAP values according to histologic steatosis grade.
The line through the box indicates the median. The bottom and top of each box represent the 25th and 75th percentiles. CAP was only significantly different between S0 and S1 (P<0.001), while difference between S1 and S2 (P = 1.000), and S2 and S3 (P = 1.000) was not significant. CAP, Controlled attenuation parameters.

