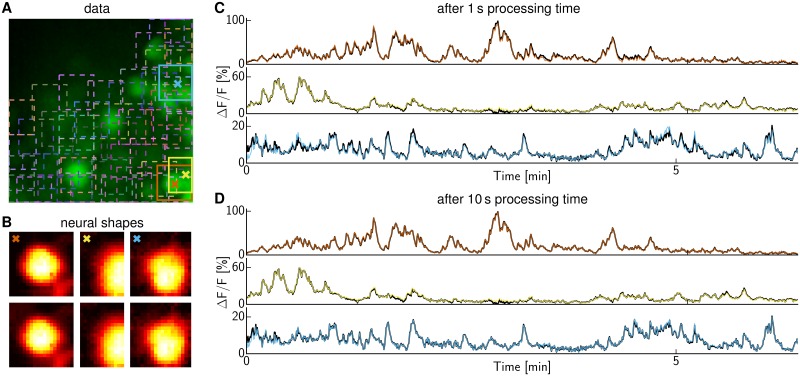
Fig 2. CNMF with and without initial decimation to speed up CNMF.
(A) Real data summary image obtained as max-projection along time-axis. Squares indicate patches centered at suspected neurons. The three highlighted neurons are considered in the next panels. (B) Extracted shapes of the three neurons highlighted in (A) using the same color code. The upper row shows the result with initial temporal decimation by a factor of 30 and spatial decimation by 3×3, followed by five final iterations on the whole data. The algorithm ran for merely 1 s. The lower row shows the result without any decimation and running until convergence, yielding virtually identical results. (C) Extracted time traces without (thick black) and with initial iterations on decimated data (color as in A) overlap well after merely 1 s. (D) They overlap almost perfectly if the algorithm using decimation is run not only for 1 but 10 s.

