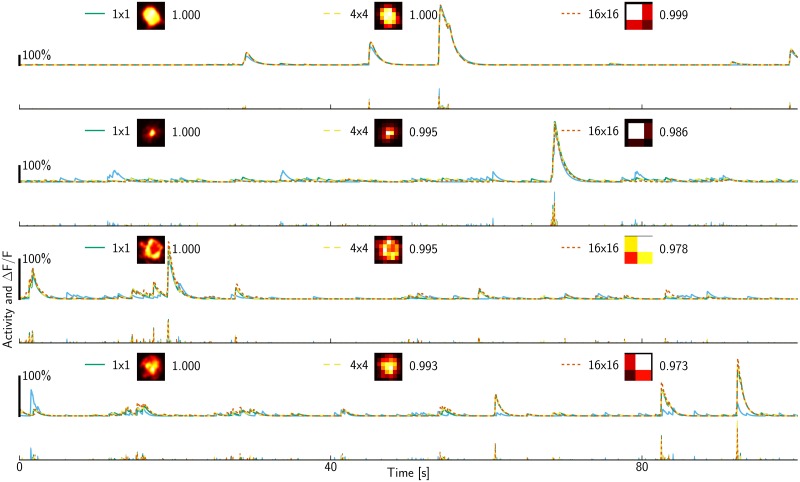
Fig 5. Inferred denoised and deconvolved traces for ROIs with rank 1, 40, 80 and 120 (top to bottom) out of a total of N = 187 ROIs in the 2P dataset.
In each row, a denoised trace from Cl is shown above the corresponding deconvolved trace from Sl. Shapes were decimated by averaging 4×4 or 16×16 pixels. The legend shows the resulting shapes Al as well as the correlation of the inferred denoised fluorescence Cl versus the estimate C1 obtained without decimation. Further, the results obtained with merely 1-phase imaging for decimation by 4×4 pixels are shown as cyan traces.

