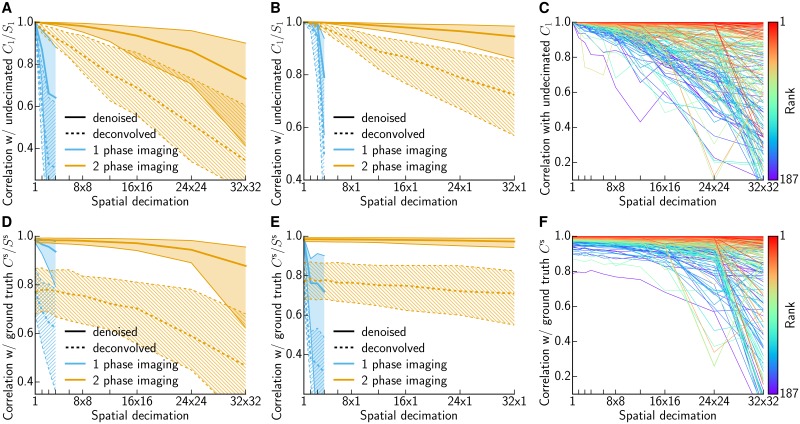
Fig 6. Quantifying the impact of decimation for 2P data.
(A) Summary of correlations between denoised traces C1 and Cl and deconvolved traces S1 and Sl. Decimating in x and y direction. Thick lines show the median, thin lines and shaded region the IQR. The correlation of denoised fluorescence (solid) decays slowly for 2 phase imaging (orange) and abruptly if the shapes Al are not inferred in the pre-screening phase but are instead estimated directly from downscaled data (cyan). The same holds for the deconvolved traces (dashed). (B) Analogous to (A), but with decimation applied just in the spatial horizontal direction. (C) Correlation of denoised fluorescence for each ROI plotted individually. Rank of ROI indicated by color; better ranked ROIs are less susceptible to decimation errors. (D-F) Analogous to (A-C), but comparing to simulated ground truth Cs instead of inferred . Traces were obtained on decimated simulated data with reshuffled residuals.

