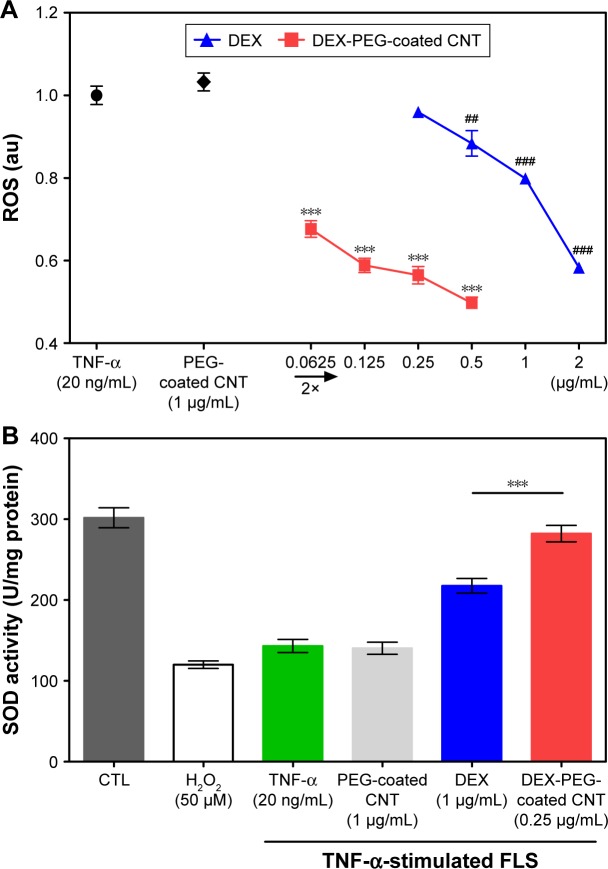
Figure 6.
Effects of nanodrug on oxidative stress in TNF-α-stimulated FLS.
Notes: (A) FLS (2×10⁴ cells/well in 96-well plates) were treated with various concentrations of DEX, PEG-coated CNT, and DEX-PEG-coated CNT for 24 h. After treatment, the cells were stained with 10 μM DCF-DA for 30 min. The fluorescent intensity of DCF-DA was recorded using a fluorescent plate reader. All data represent mean ± SEM (n=5). ##P<0.01; and ***P< ###P<0.001, compared to the TNF-α-stimulated positive control. (B) Cells (4×10⁵ cells/well in 6-well plates) were treated with DEX-PEG-coated CNT (0.25 μg/mL), DEX, and PEG-coated CNT (1 μg/mL) for 24 h. SOD activity was determined using a tetrazolium-based SOD assay kit. H2O2 (100 μM) was used as a positive control. The results are presented as mean ± SEM (n=3). ***P<0.01 significantly different from DEX-treated group.
Abbreviations: CNT, carbon nanotube; DCF-DA, 2′,7′-dichlorodihydrofluorescein diacetate; DEX, dexamethasone; FLS, fibroblast-like synoviocytes; H2O2, hydrogen peroxide; PEG, polyethylene-glycol; ROS, reactive oxygen species; SEM, standard error of the mean; SOD, superoxide dismutase; TNF-α, tumor necrosis factor-α.

