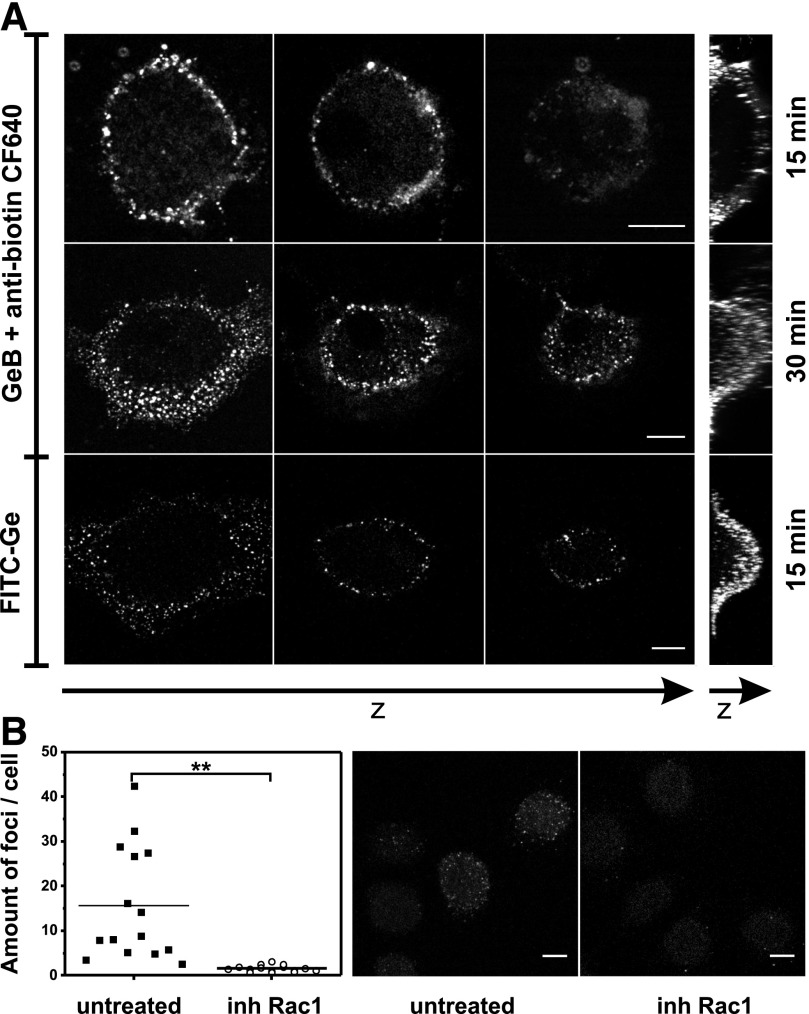
Figure 3. GeB or FITC-Ge-inhibited HSP90 molecules are detected on the hMDMs surface.
(A) Confocal microscopy 3D image of hMDMs incubated with biotinylated GeB (20 µM) for 15 min or 30 min and then labeled with CF640R-conjugated anti-biotin mAbs, or hMDMs incubated with FITC-Ge (20 µM) for 15 min. Before imaging, all samples were fixed with 4% PFA. Rows represent 3 horizontal single cross sections of the cell, followed by vertical maximum pixel value Z-stack projections. Scale bar, 10 µm. Control staining for CF640R-conjugated anti-biotin mAbs is presented in Supplemental Fig. 1. (B) Cultured hMDMs were left untreated or pretreated with Rac1 inhibitor (NSC23766) and then incubated with FITC-Ge (20 µM) for 20 min. Before imaging, samples were fixed with 4% PFA. Confocal microscopy 3D images were analyzed, and the mean amount of foci per cell from separate fields of view was determined. The images are Z-stack projections of the representative cells. Scale bar, 10 µm.

