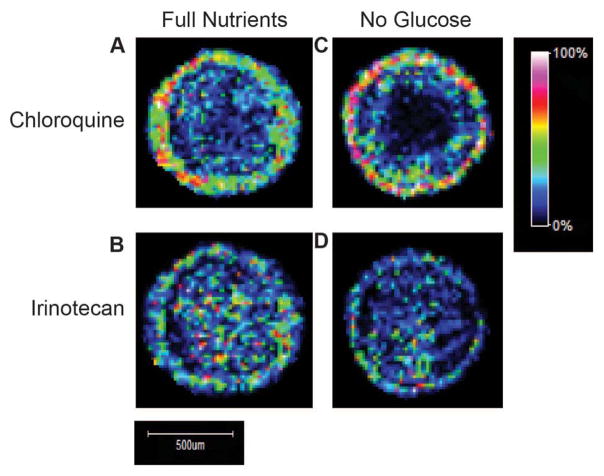
Figure 2.
MALDI-IMS analysis of treated HCT 116 spheroids (n=3). A. Imaging of CQ (m/z 320) in a spheroid treated with full nutrient media in addition to CQ and IR. B. Imaging of IR (m/z 587) in a spheroid treated with full nutrient media in addition to CQ and IR. C. Imaging of CQ in a spheroid treated with no glucose media in addition to CQ and IR. CQ is localized to the outer region of the spheroids in both conditions. D. Imaging of IR in a spheroid treated with no glucose media in addition to CQ and IR. Images are normalized to total ion current and intensity scale on right shows localization of ions. IR is distributed throughout the spheroid in both conditions.

