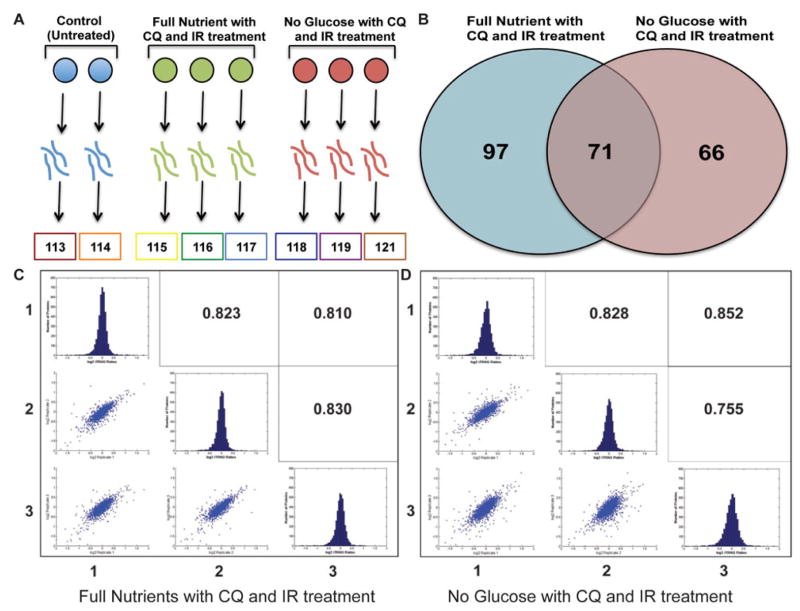
Figure 4.
A. iTRAQ 8-plex experimental set-up. Spheroids (n=30) were homogenized, digested, and labeled with a specific reporter ion. Samples were mixed together, fractionated and analyzed by tandem mass spectrometry. B. Reporter ion intensities were compared to control and proteins outside the 1.5 log2 ratio were considered to be differentially up or down regulated. Full nutrient with CQ and IR treatment had 168 proteins that were differentially regulated and no glucose with CQ and IR treatment had 137 proteins differentially regulated, 71 of the proteins overlapped. C. and D. Log2 iTRAQ fold change ratios histograms were plotted of biological triplicates of treatment conditions compared to the untreated control. The biological triplicate conditions were compared with a Pearson’s correlation and scatter plot were used to measure linear correlation between replicates.

