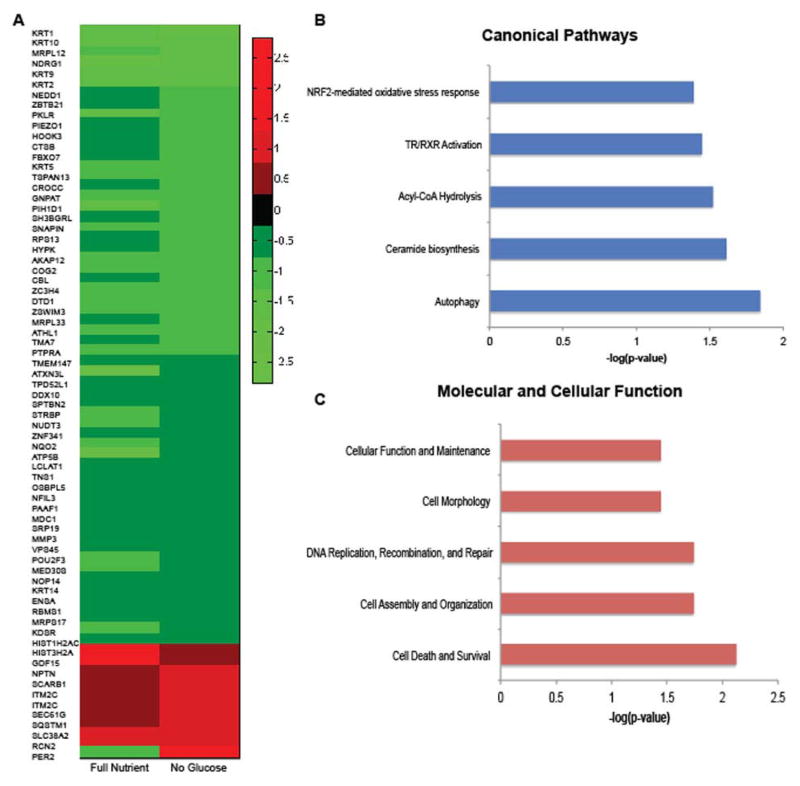
Figure 5.
A. A heatmap of the 71 common differentially regulated proteins between treatment conditions was plotted using MatLab. Only one protein, PER2, common to both conditions was oppositely regulated. B. The canonical pathways of the 71 common proteins were analyzed using IPA and the top 5 enriched pathways are displayed. C. The 71 common proteins were analyzed using IPA and the top 5 enriched molecular and cellular functions are displayed.

