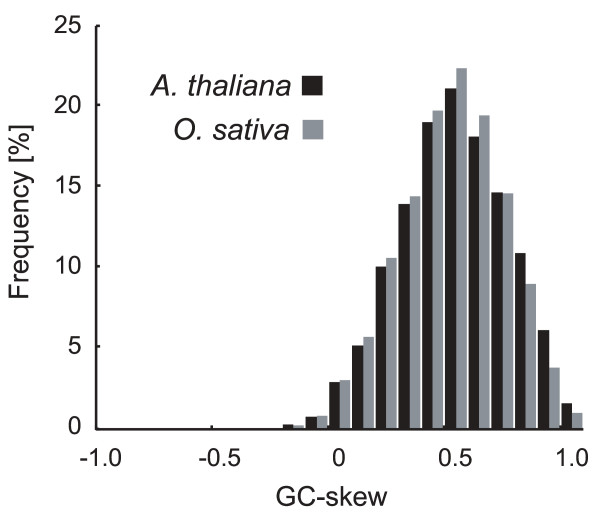
Figure 2.
Distribution of maximum GC-skew values around the TSS in Arabidopsis and rice genes. The graph illustrates the distribution of maximum GC-skew values within 100-bp up- and downstream of the TSS in Arabidopsis and rice. The GC-skew values were computed using the sliding-window technique (window size = 100 bp; shift size = 1 bp). The numbers of sequences analyzed were 7,708 for Arabidopsis and 14,868 for rice.

