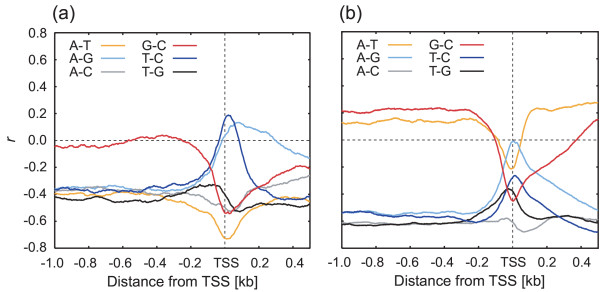
Figure 4.
Correlation between the two nucleotide frequencies in plants. The figure illustrates the correlation coefficients (r) between the two nucleotide frequencies (A-T, A-G, A-C, G-C, T-C and T-G) at each position around the TSS in (a) Arabidopsis and (b) rice genes. Each nucleotide frequency at a particular position was defined as the frequency of the nucleotide in a 100-bp window at that position. Correlation coefficients were calculated using these frequencies (see Methods section). The numbers of sequences analyzed were 7,708 for Arabidopsis and 14,868 for rice.

