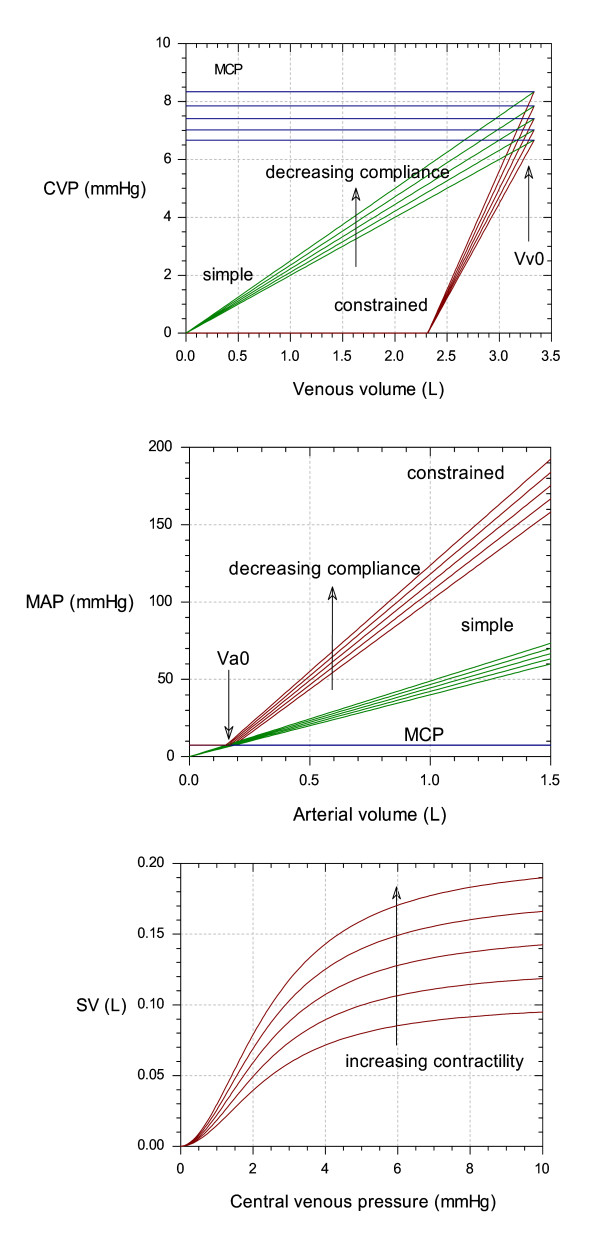
Figure 6.
Effect of introducing constraints on the model. Top: Venous pressure – volume curves. Venous volume starts at Vv0 when the heart is not pumping, at which point the venous pressure is the mean circulatory pressure (MCP). With increased pumping, the venous volume and venous pressure is reduced. In the simple (Frank-Starling-Baroreceptor) model, the CVP – volume relationship was linear, with an intercept of zero. In the constrained model, a lower intercept was used which was necessary to produce realistic venous volumes under baseline conditions. The multiple curves in the plot show the effect of changing venous compliance (CPLv). Middle: Arterial pressure – volume curves. Arterial volume starts at Va0 when the heart is not pumping, at which point the arterial pressure is the mean circulatory pressure (MCP). With increased pumping, the arterial volume and arterial pressure are increased. In the simple model, the MAP – volume relationship was linear, with an intercept of zero. In the constrained model, a lower intercept was the used, which was necessary to produce realistic arterial volumes under baseline conditions. The multiple curves in the plot show the effect of changing compliance (CPLa). Bottom: "Cardiac output curves" In this case cardiac output is given by stroke volume, which is plotted against central venous pressure (CVP). In the simple model, this relationship was linear. In the constrained model the relationship was given by a logistic equation which rose to a limit. The left-hand side of the curves are pseudo-linear, and the slope of the lines increase with increasing contractility. This behaviour mimics the "Cardiac output curves" found in many cardiovascular textbooks (e.g. Guyton [19]).

