
Fig 4.
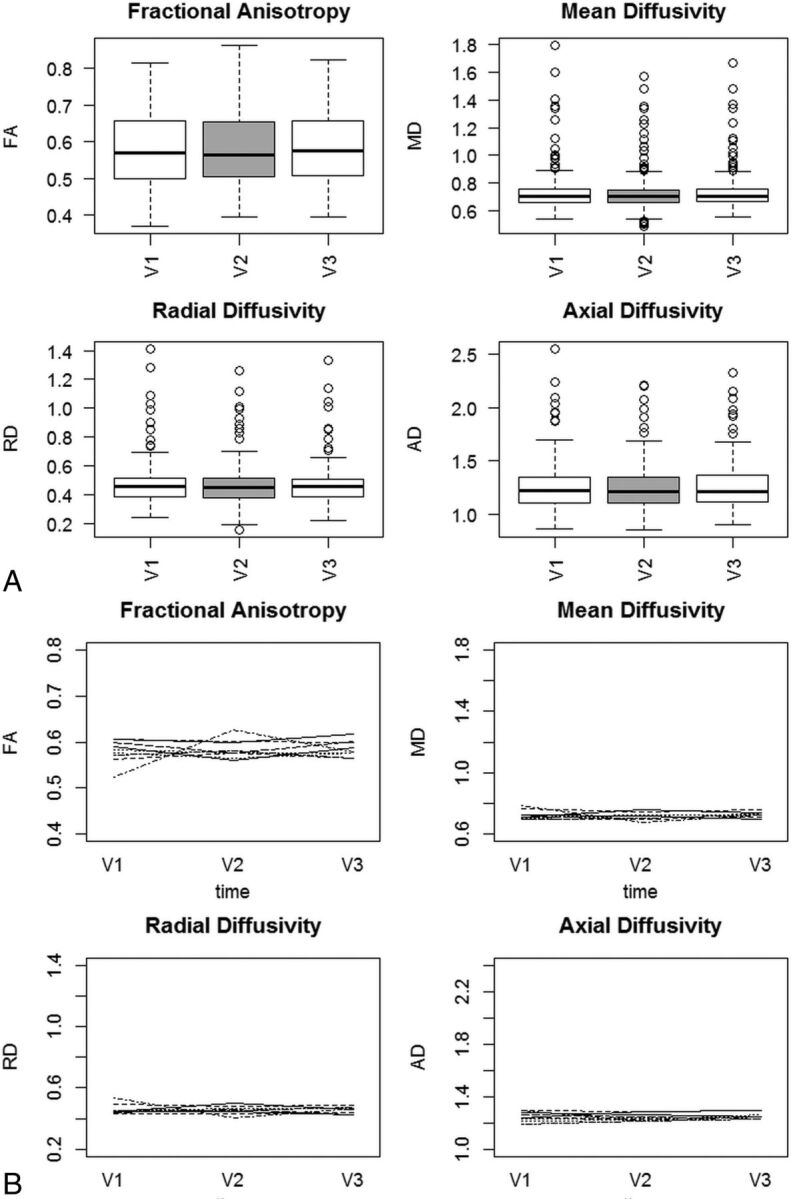
A, FA, MD, RD, and AD in seropositive participants following HIV infection but before treatment was started. Measurements are aggregated across 28 white matter ROIs.47 Data were collected pretreatment (V1), 3 months later (V2), and 6 months later (V3). B, Individual time plots of FA, MD, RD, and AD in seropositive participants following HIV infection.