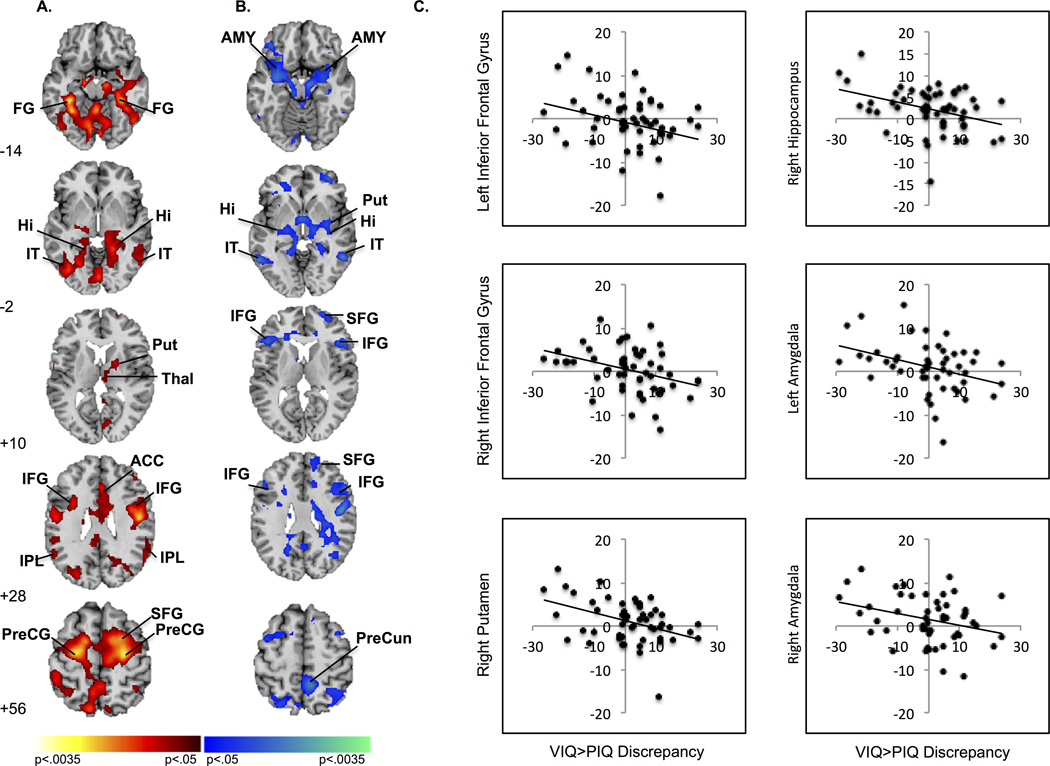
Figure 1.
Average brain activations associated with conflict resolution. (A) Increased activation during conflict resolution was detected in frontal, temporal, parietal, and striatal regions. Increases in signal are in red and decreases in blue. (B) Activation during conflict resolution in frontostriatal regions, hippocampus, and amygdala inversely associated with VIQ>PIQ discrepancy. Positive correlations are in red and inverse in blue. (C) Scatterplots demonstrate decreasing activation in left (−38,38,−8) and right (48,23,13) IFG, left (−21, −7, −23) and right (27, −2, −18) amygdala, and right Put (34,−7,−5 ) and Hippocampus (−34, −25, −10) with increasing magnitude of VIQ>PIQ discrepancy. Maps (generated with MRIcroN; McCausland Center for Brain Imaging, Columbia, South Carolina) are thresholded at p < .0125, with cluster filter 38. ACC, anterior cingulate cortex; AMY, amygdala; FG, fusiform gyrus; Hi, hippocampus; IFG, inferior frontal gyrus; IPL, inferior parietal lobule; IT, inferior temporal gyrus; PreCG, precentral gyrus; PreCun, precuneus; Put, putamen; Thal, thalamus; SFG, superior frontal gyrus.

