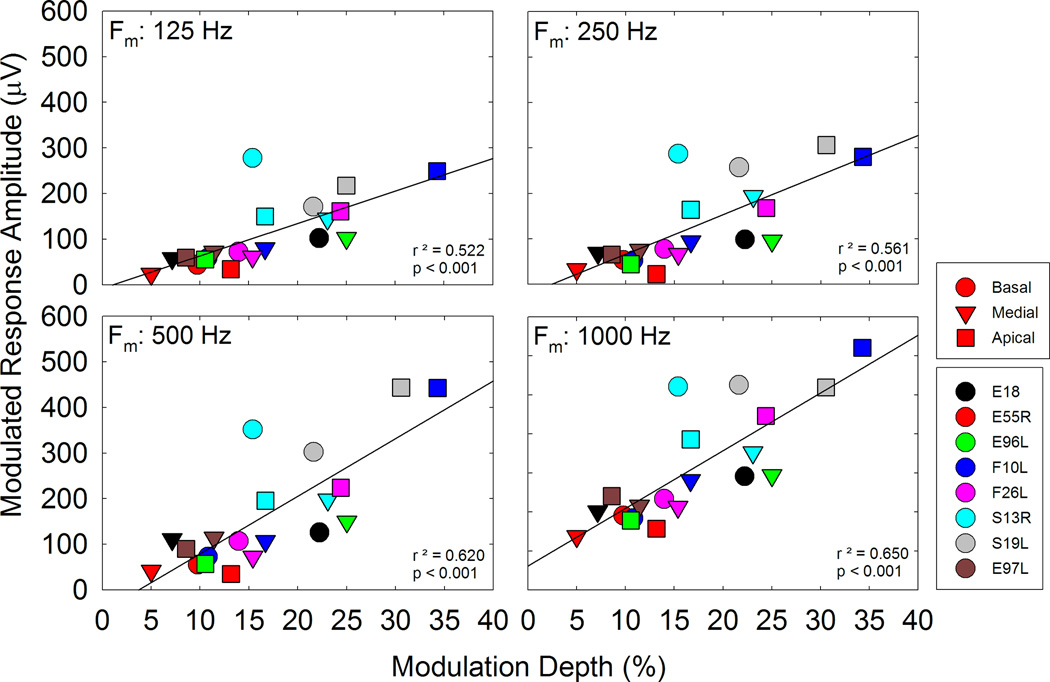
Figure 12.
MRA is plotted as a function of modulation depth (m). Each plot includes data from the 8 participants and 3 electrodes; each plot shows data for a different modulation frequency as indicated on the plot. Linear regression lines show significant correlations between modulation depth and MRA for all frequencies.

