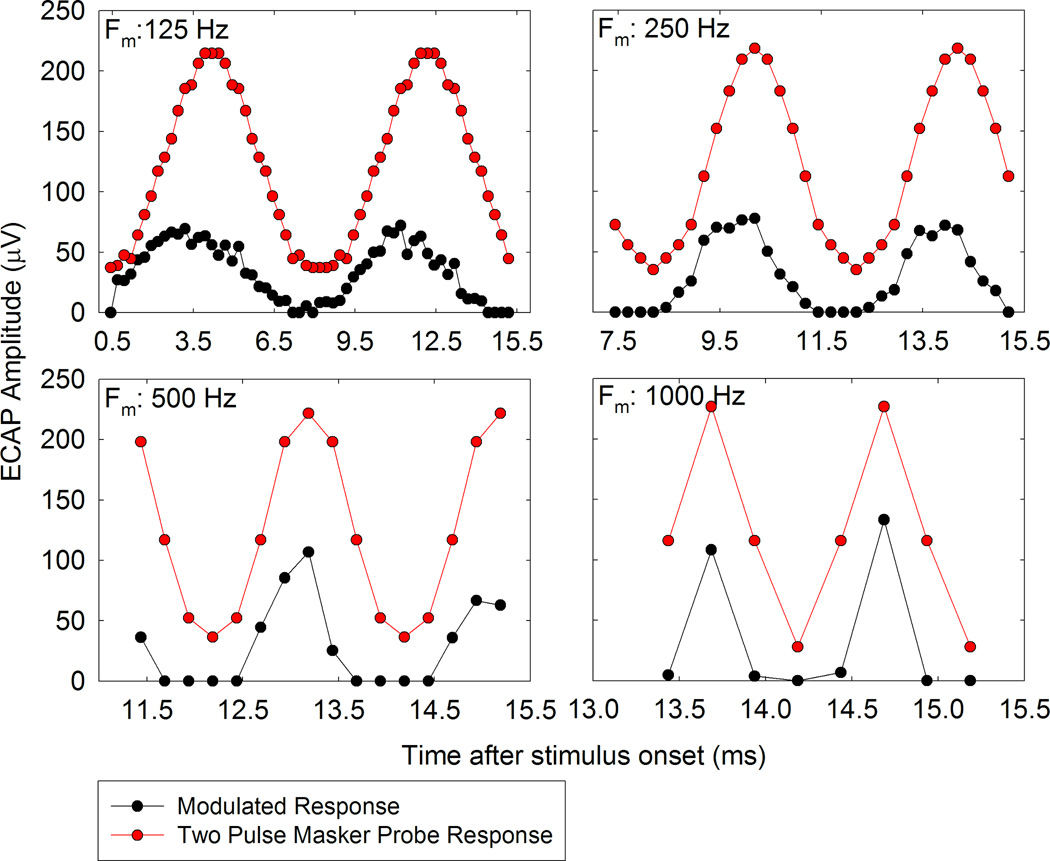
Figure 5.
Responses to amplitude modulated pulse trains (black symbols) presented to electrode 4 of participant F26L are plotted as a function of time after stimulus onset for four different modulation frequencies indicated on each plot. ECAP amplitudes to a single pulse (recorded using the standard two-pulse subtraction paradigm) at each of the levels used in the amplitude modulated stimulus are plotted on the same time axis (red symbols).

