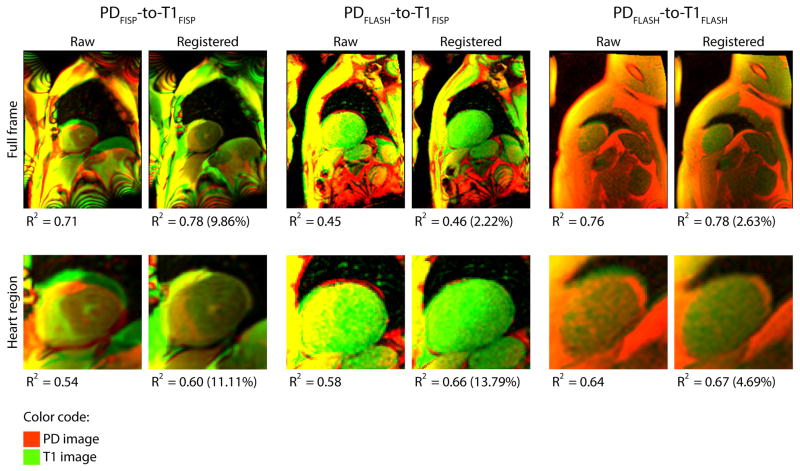
Figure 4. Comparison of PD-to-Perfusion Image Registration.
Top two rows show examples of PD (red) to T1 perfusion (green) image registration with corresponding correlation coefficient (R2) for three different sequence combinations. Percent change in correlation scores between the PD and T1 images after registration are shown in brackets next to the scores.

