
Figure 3.
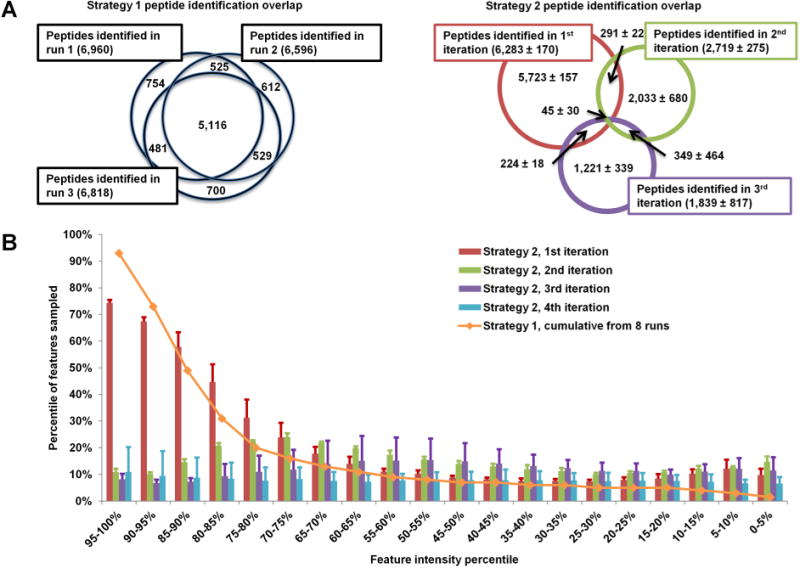
Effect of iterative exclusion. In conventional analysis (Strategy 1), over 70% of identified peptides are redundant between replicates (A, left). In iterative exclusion (Strategy 2), this overlap is reduced to 10–30% (A, right). This decrease in redundant fragmentation allows the MS instrument to target medium and low-abundance peptides, as shown in panel B, where the blue line presents the sampling coverage by Strategy 1 from eight replicate runs and the bar graphs represent the iterations of Strategy 2 (average of three runs).