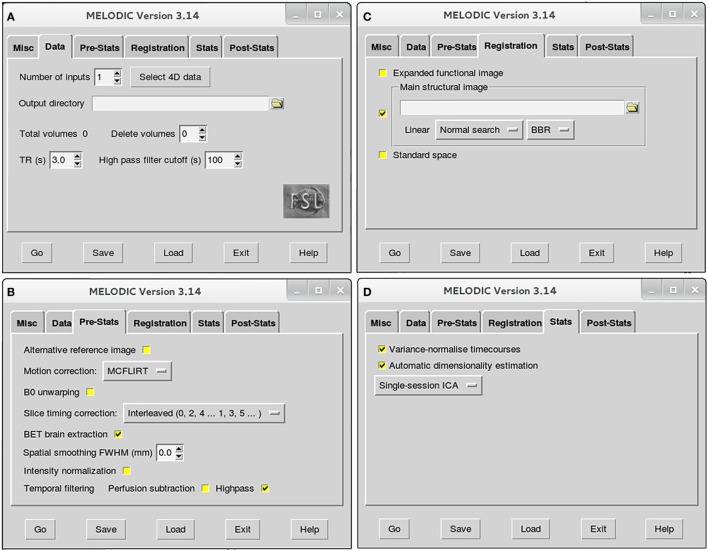
Figure 2.
Melodic graphical user interface. Melodic interface is organized into tabs, within which available options for data processing are presented. Selections will be altered in the Data (A), Pre-Stats (B), Registration (C), and Stats tabs (D) according to the stage of analysis (i.e., preprocessing or final brain network analysis). Melodic interface provides helpful descriptions of each option, viewed by holding ones cursor over a given icon.

